Measuring Webhook Health: Tracking First-Attempt Success Rate (FASR)
Measuring Webhook Health: Tracking First-Attempt Success Rate (FASR) The Illusion of "Eventual Delivery" in Webhook Systems In modern event-driven architectures, webhooks act as...
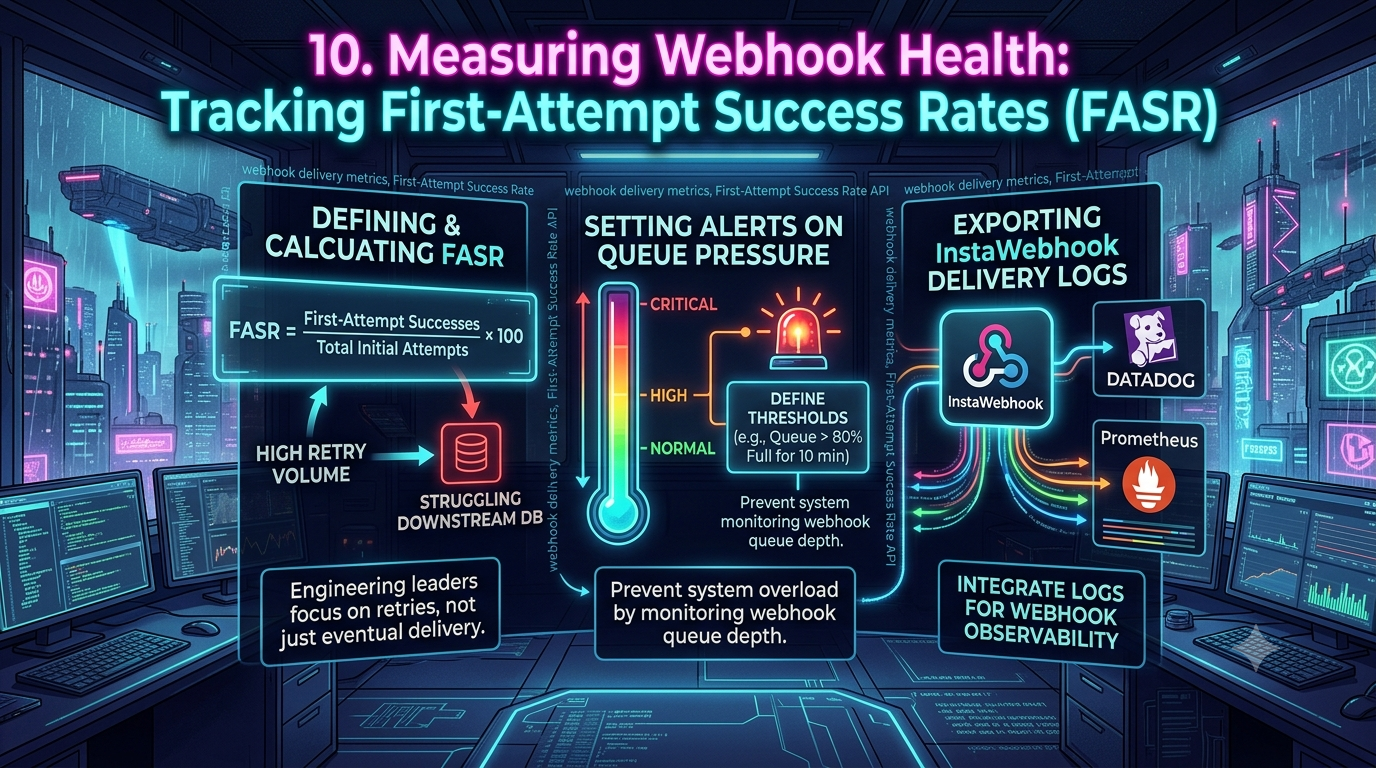
Measuring Webhook Health: Tracking First-Attempt Success Rate (FASR)
1. The Illusion of "Eventual Delivery" in Webhook Systems
In modern event-driven architectures, webhooks act as the nervous system connecting decoupled microservices, payment gateways, e-commerce stores, and third-party SaaS applications. When evaluating system health, engineering teams frequently rely on a single top-level Service Level Objective (SLO): Eventual Success Rate (ESR).
A status dashboard displaying "99.99% Eventual Webhook Delivery Success" creates a comfortable sense of security. However, for Site Reliability Engineers (SREs) and platform leaders, this single metric often masks critical underlying architectural failures.
                  THE EVENTUAL DELIVERY TRAP

+------------------+     Attempt #1: 504 Timeout     +---------------------+
| Webhook Producer | ------------------------------> | Downstream Database |
+------------------+                                 | (Lock Contention)   |
        |                                            +---------------------+
        | Retry #1 (T + 10s): 504 Timeout                       ^
        | Retry #2 (T + 60s): 504 Timeout                       |
        | Retry #3 (T + 300s): 200 OK  -------------------------+
        v
Result: Marked as "SUCCESSFUL" in Eventual Metrics
Reality: 5-minute processing delay, queue backlog, worker thread exhaustion
If a webhook succeeds on its fourth retry attempt after 15 minutes of exponential backoff, traditional logging marks the payload as delivered. But what was the operational cost of that eventual delivery?
- Queue Pressure and Worker Exhaustion: Retrying millions of payloads forces event brokers (e.g., RabbitMQ, Apache Kafka, or AWS SQS) to retain messages longer, increasing memory usage and thread contention.
- Hidden Downstream Bottlenecks: A spike in retry volume usually indicates that a downstream consumer endpoint is struggling — often due to slow database queries, connection pool exhaustion, or unoptimized synchronous business logic.
- Out-of-Order Execution: Delayed retries can break chronological ordering. If an
order.createdwebhook is retried for 10 minutes, anorder.cancelledwebhook emitted shortly after might be processed first by the receiver, creating data corruption and inconsistent state. This is precisely why most providers issue an at-least-once (not exactly-once, not strictly-ordered) delivery guarantee — more on this in the idempotency section below.
To build resilient, high-throughput integration ecosystems, engineering leaders must shift their focus from eventual delivery to First-Attempt Success Rate (FASR) — a practical North Star metric for webhook observability. It's worth noting up front that "FASR" isn't a formally standardized industry acronym; you won't find it defined in an RFC. But the underlying measurement — the share of events that succeed without needing a retry — is exactly what mature webhook infrastructure providers already track. Hookdeck, for example, publishes a "delivery success rate" metric for this purpose and recommends keeping it above 99%, while explicitly calling out that a declining rate (even while eventual delivery stays high) signals that destinations are slow, erroring, or down.
2. Defining First-Attempt Success Rate (FASR)
First-Attempt Success Rate (FASR) measures the percentage of HTTP webhook payloads successfully delivered and acknowledged with an acceptable status code (typically 200 OK through 299) on the initial transmission attempt, without requiring retry mechanisms.
2.1 The FASR Formula
$$FASR = \left( \frac{N_{\text{success, attempt}=1}}{N_{\text{total, attempt}=1}} \right) \times 100$$
Where:
- $N_{\text{success, attempt}=1}$ is the count of webhook HTTP requests that return an HTTP 2xx status code on attempt index 1 within the observation window.
- $N_{\text{total, attempt}=1}$ is the total volume of distinct webhook events emitted for their initial delivery attempt during the same window.
2.2 Comparative Metric Matrix
To get a complete view of webhook delivery health, FASR should be evaluated alongside supplementary indicators:
| Webhook Metric | Calculation | Suggested Target | Operational Focus |
|---|---|---|---|
| First-Attempt Success Rate (FASR) | $\frac{\text{Successes}_{\text{Attempt 1}}}{\text{Total Initial Ingress}} \times 100$ | $> 98%$ | Endpoint responsiveness, zero-queue overhead |
| Eventual Success Rate (ESR) | $\frac{\text{Total Unique Delivered Events}}{\text{Total Unique Ingested Events}} \times 100$ | $> 99.9%$ | Data integrity, overall pipeline durability |
| Mean Time to Deliver (MTTD) | $\frac{\sum (T_{\text{delivered}} - T_{\text{emitted}})}{N_{\text{delivered}}}$ | $< 500\text{ ms}$ | Pipeline latency, event freshness |
| Retry-to-Ingress Ratio | $\frac{\text{Total Retried Attempts}}{\text{Total Initial Ingress}}$ | $< 0.05$ | Infrastructure inefficiency, downstream stress |
A caveat worth stating plainly: the specific target numbers above (98%, 99.9%, 500ms) are reasonable engineering benchmarks, not universally published SLAs — no major provider we could find guarantees a specific first-attempt percentage. Treat them as a sane starting point to tune against your own traffic and endpoint mix, not as a certification you can point to. One data point worth knowing: at least one webhook infrastructure vendor (Kanopy) has published an estimate that roughly 15% of webhook deliveries fail on the first attempt across typical SaaS integrations — a useful sanity check, though it's a vendor estimate rather than an audited industry-wide figure.
When your FASR drops while your ESR remains flat, your system is consuming extra compute and memory to force payloads through a congested receiver — the retries are doing the work that a healthy first attempt should have done.
3. What Real Webhook Providers Actually Guarantee
Here's something that surprises a lot of teams: "webhooks" is not one contract. Every provider defines its own timeout window, retry count, and backoff schedule, and some don't retry at all. If you're building alerting thresholds or an SLA around FASR, you need to know what your actual upstream and downstream partners promise — not what you assume "a webhook" does.
| Provider | Response timeout | Retry behavior | Notes |
|---|---|---|---|
| Stripe | ~20 seconds | Exponential backoff for up to 3 days in live mode; only 3 retries over a few hours in test mode | Disables the endpoint and emails you if it keeps failing; exact backoff steps aren't published, but community-observed schedules run roughly immediate → 5 min → 30 min → 2 hr → 5 hr → 10 hr → every 12 hr |
| GitHub | 10 seconds | None, automatically. GitHub does not retry a failed delivery on its own | You must manually redeliver via the UI/API, or build a scheduled script that polls the deliveries API and redelivers failures yourself |
| Shopify | ~5 seconds | Retries with backoff (shortest window among major providers) | Tight timeout makes the "acknowledge fast, process later" pattern essentially mandatory |
| Svix (webhook-sending infrastructure) | 15 seconds | Published 8-attempt schedule: immediate, +5s, +5m, +30m, +2h, +5h, +10h, +10h (last attempt ~27h35m after the first) | One of the few providers that documents its exact schedule publicly |
| Recurly | — | Up to 10 retries, delay approximated by 10 + x·2^(x+5) seconds where x is the retry index | Early retries are fast, later ones space out substantially |
| Alloy / many "Standard Webhooks"-style APIs | ~10 seconds | Multiple attempts, then endpoint marked failed after a sustained failure window (e.g., 72 hours of >95% non-2xx) | Illustrates a common convention across smaller platforms |
The takeaway for FASR tracking: don't build a single global timeout assumption into your instrumentation. Tag every delivery-attempt log with the source provider (or, for outbound webhooks you send yourself, with the destination endpoint) so you can evaluate FASR per-contract rather than against one blended number that hides which relationships are actually degrading.
4. Anatomy of First-Attempt Webhook Failures
Analyzing the HTTP status codes generated during first-attempt failures reveals the health of downstream infrastructure. When building a first-attempt monitoring workflow, group status codes into failure archetypes:
                  First-Attempt Failure Breakdown (illustrative example)

   HTTP 429 Too Many Requests   [====================] 45% (Rate Limit Exceeded)
   HTTP 504 Gateway Timeout     [==============      ] 30% (DB Connection Lock)
   HTTP 500 Internal Error      [========            ] 15% (Unhandled Exceptions)
   HTTP 502/503 Service Unavailable [====          ] 10% (Pod Restarts/OOM)
(The exact proportions above are illustrative — your own breakdown will depend heavily on your consumers' architecture. The point is to break the aggregate failure count down by status code rather than treat "not 2xx" as one bucket.)
4.1 HTTP 429: Downstream Rate Limit Exceeded
When a receiver responds with 429 Too Many Requests on attempt #1, the producer is overwhelming the consumer's ingress. HTTP 429, along with 503 Service Unavailable, is the standard mechanism (defined in the HTTP semantics RFC, RFC 9110) for a server to signal "back off" — and the accompanying Retry-After header, when a provider sends one, tells the client exactly how long to wait. A producer that ignores Retry-After and keeps retrying on its own fixed schedule is a common, avoidable cause of retry storms.
4.2 HTTP 504 / 502: The Downstream Database Squeeze
A sudden drop in FASR characterized by 504 Gateway Timeout or 502 Bad Gateway points to synchronous blocking operations on the consumer side. Consider this typical antipattern inside a webhook processing endpoint:
[ POST /webhooks/stripe ]
         │
         ├──> 1. Parse JSON Payload
         ├──> 2. Open PostgreSQL Connection (Pool: 20 max)
         ├──> 3. Execute SELECT ... FOR UPDATE (Blocking Query: 1200ms)
         ├──> 4. Call Third-Party API (Blocking HTTP: 800ms)
         └──> 5. Return HTTP 200 OK (Total Wall Time: 2000ms+)
If the producer sends 50 concurrent webhooks, the receiver's connection pool fills up immediately. Subsequent requests queue up at the ingress layer (NGINX, an API gateway, or a cloud load balancer) until the proxy's own idle timeout is reached. This is a good place to fact-check a common assumption: AWS's Application Load Balancer does not default to a 30-second idle timeout — its default is 60 seconds (configurable from 1 to 4,000 seconds), and AWS Network Load Balancers default to 350 seconds. Whatever the number, once it's hit, the proxy returns its own timeout error, the event broker queues a retry, and the traffic spike escalates into a retry storm.
5. Measuring Queue Pressure and Retry Depth
Monitoring FASR alone tells you that a problem exists; tracking queue pressure tells you how long until your delivery infrastructure fails outright.
5.1 Quantifying Queue Pressure
Queue Pressure ($P_{\text{queue}}$) measures the imbalance between the incoming webhook generation rate ($\lambda_{\text{ingress}}$), the retry generation rate ($\lambda_{\text{retry}}$), and the underlying processing capacity ($\mu_{\text{workers}}$):
$$P_{\text{queue}} = \frac{\lambda_{\text{ingress}} + \lambda_{\text{retry}}}{\mu_{\text{workers}}}$$
This isn't a novel formula specific to webhooks — it's the same utilization factor (ρ = λ / μ) used throughout classical queueing theory, and it connects directly to Little's Law (L = λW: the average number of items in a system equals the arrival rate times the average time an item spends in the system). The standard result from that theory holds here too: when $P_{\text{queue}} > 1.0$ (i.e., arrivals outpace service capacity), queue depth grows without bound and latency for every event — not just the retried ones — increases.
                       QUEUE PRESSURE DYNAMICS

  Ingress Rate (λ_ingress = 1,000 req/s) ──┐
                                           ├──> [ Ingestion Queue ] ──> Workers (μ = 1,200 req/s)
  Retry Rate   (λ_retry   = 500 req/s) ────┘        (P_queue = 1.25)
                                                    *SYSTEM UNSTABLE*
5.2 Calculating Retry-Induced Latency Overhead
To isolate the latency overhead caused by retries, compute:
$$RILO = \text{Percentile}{99}(T{\text{delivered}}) - \text{Percentile}{99}(T{\text{first_attempt}})$$
A healthy pipeline should maintain RILO near 0 ms. If it rises to several minutes, events are spending significant time sitting in exponential backoff queues rather than processing in real time.
6. Exporting Webhook Delivery Telemetry to Datadog and Prometheus
Whether you run your own delivery workers or use a managed relay service (examples in this category include Svix, Hookdeck, Convoy, and InstaWebhook), the instrumentation pattern is the same: capture a structured record for every delivery attempt — not just every event — and export it to your metrics stack.
6.1 Representative Telemetry Schema
The exact field names will differ by vendor, but a typical per-attempt log looks like this:
{
  "timestamp": "2026-09-16T09:45:00.123Z",
  "event_id": "evt_99f823a10bc",
  "tenant_id": "org_acme_corp",
  "endpoint_id": "ep_7721b0a9",
  "destination_url": "https://api.acme.com/v1/orders/webhook",
  "attempt_number": 1,
  "max_attempts": 5,
  "status": "failed",
  "http_status_code": 504,
  "execution_duration_ms": 30002,
  "retry_reason": "GATEWAY_TIMEOUT",
  "next_retry_at": "2026-09-16T09:45:30.123Z"
}
InstaWebhook, as one example of a managed delivery relay, publicly documents that it tracks each event through received, queued, attempted, retried, delivered, and dead-lettered states, signs outgoing deliveries with timestamped HMAC signatures, and offers a "bring your own database" mode for teams that need to keep payloads under their own storage controls. If you're evaluating a relay service rather than building your own, those are the kinds of capabilities worth checking for — regardless of which vendor you choose.
6.2 Exporting Metrics to Datadog
To stream metrics into Datadog, use DogStatsD (via the official datadog Python package, still the current, actively maintained client for this) with standard tags (tenant_id, endpoint_id, status, attempt_number).
import os
from datadog import initialize, statsd

# Initialize Datadog client
initialize(statsd_host=os.getenv("DOGSTATSD_HOST", "localhost"), statsd_port=8125)

def process_webhook_telemetry(log_event: dict) -> None:
    """
    Parses incoming delivery-attempt logs and converts them
    into Datadog metrics for FASR and latency tracking.
    """
    tenant_id = log_event.get("tenant_id", "unknown")
    endpoint_id = log_event.get("endpoint_id", "unknown")
    attempt = log_event.get("attempt_number", 1)
    status_code = str(log_event.get("http_status_code", 0))
    duration_ms = log_event.get("execution_duration_ms", 0)

    tags = [
        f"tenant:{tenant_id}",
        f"endpoint:{endpoint_id}",
        f"attempt:{attempt}",
        f"status_code:{status_code}"
    ]

    # Increment overall attempt counter
    statsd.increment("webhook.delivery.attempts.total", tags=tags)

    # Track first-attempt metrics specifically
    if attempt == 1:
        is_success = 200 <= log_event.get("http_status_code", 0) < 300
        if is_success:
            statsd.increment("webhook.delivery.first_attempt.success", tags=tags)
        else:
            statsd.increment("webhook.delivery.first_attempt.failure", tags=tags)

        statsd.histogram("webhook.delivery.first_attempt.latency_ms", duration_ms, tags=tags)
    else:
        # Increment retry attempt counter
        statsd.increment("webhook.delivery.retry.attempts.total", tags=tags)
Datadog FASR Metric Queries
-
First-Attempt Success Rate (%):
Code example( sum:webhook.delivery.first_attempt.success{*}.as_count() / sum:webhook.delivery.attempts.total{attempt:1}.as_count() ) * 100 -
Retry Volume Ratio:
Code examplesum:webhook.delivery.retry.attempts.total{*}.as_count() / sum:webhook.delivery.attempts.total{*}.as_count()
6.3 Exporting Metrics to Prometheus
Prometheus follows a pull-based model. Below is a Python exporter using the standard prometheus_client library to expose a /metrics endpoint for delivery telemetry:
import time
from prometheus_client import start_http_server, Counter, Histogram

WEBHOOK_ATTEMPTS_TOTAL = Counter(
    'webhook_delivery_attempts_total',
    'Total count of webhook delivery attempts executed',
    ['tenant_id', 'endpoint_id', 'attempt', 'status_code']
)

WEBHOOK_FIRST_ATTEMPT_SUCCESS = Counter(
    'webhook_first_attempt_success_total',
    'Total count of webhooks delivered successfully on attempt 1',
    ['tenant_id', 'endpoint_id']
)

WEBHOOK_DELIVERY_DURATION = Histogram(
    'webhook_delivery_duration_seconds',
    'Latency histogram of webhook execution in seconds',
    ['tenant_id', 'attempt'],
    buckets=(0.05, 0.1, 0.25, 0.5, 1.0, 2.5, 5.0, 10.0, 30.0)
)

def record_prometheus_telemetry(tenant_id: str, endpoint_id: str, attempt: int, status_code: int, duration_sec: float):
    """
    Records delivery-attempt metadata into Prometheus Counter and Histogram vectors.
    """
    str_attempt = str(attempt)
    str_status = str(status_code)

    WEBHOOK_ATTEMPTS_TOTAL.labels(
        tenant_id=tenant_id,
        endpoint_id=endpoint_id,
        attempt=str_attempt,
        status_code=str_status
    ).inc()

    WEBHOOK_DELIVERY_DURATION.labels(
        tenant_id=tenant_id,
        attempt=str_attempt
    ).observe(duration_sec)

    if attempt == 1 and 200 <= status_code < 300:
        WEBHOOK_FIRST_ATTEMPT_SUCCESS.labels(
            tenant_id=tenant_id,
            endpoint_id=endpoint_id
        ).inc()

if __name__ == '__main__':
    start_http_server(9102)
    print("Webhook Telemetry Prometheus Exporter running on port :9102/metrics")
    while True:
        time.sleep(1)
PromQL Queries for Prometheus & Grafana
-
Global FASR over a 5-minute window:
Code example( sum(rate(webhook_first_attempt_success_total[5m])) / sum(rate(webhook_delivery_attempts_total{attempt="1"}[5m])) ) * 100 -
Retry pressure (retries vs. first attempts):
Code examplesum(rate(webhook_delivery_attempts_total{attempt!="1"}[5m])) / sum(rate(webhook_delivery_attempts_total{attempt="1"}[5m])) -
P99 latency for first attempts:
Code examplehistogram_quantile(0.99, sum(rate(webhook_delivery_duration_seconds_bucket{attempt="1"}[5m])) by (le))
7. Setting Up Production Alerts for Queue Pressure and FASR Degradation
ALERTING FLOWCHART
+-------------------------------------------------------+
| FASR Drops Below 95% over 5-min Window |
+-------------------------------------------------------+
|
Is Queue Pressure > 1.5?
/ \
YES NO
/ \
+-------------------------+ +-------------------------+
| P1 Critical Alert: | | P2 Warning Alert: |
| "Downstream Collapse / | | "Degraded Endpoint / |
| Retry Queue Backlog" | | Rate Limit Exceeded" |
+-------------------------+ +-------------------------+
7.1 Alerting Rule 1: FASR Critical Drop (P1)
groups:
- name: webhook_health_alerts
rules:
- alert: WebhookLowFASR
expr: |
(
  sum(rate(webhook_first_attempt_success_total[5m]))
  /
  sum(rate(webhook_delivery_attempts_total{attempt="1"}[5m]))
) * 100 < 92.0
for: 5m
labels:
severity: critical
team: platform-integrations
annotations:
summary: "Webhook First-Attempt Success Rate (FASR) dropped below 92%"
description: "Current FASR is {{ $value | printf \"%.2f\" }}%. Downstream endpoints are failing initial delivery, causing queue buildup."
7.2 Alerting Rule 2: High Retry-to-Ingress Ratio (P2)
      - alert: HighWebhookRetryRatio
        expr: |
          sum(rate(webhook_delivery_attempts_total{attempt!="1"}[10m]))
          /
          sum(rate(webhook_delivery_attempts_total{attempt="1"}[10m])) > 0.15
        for: 10m
        labels:
          severity: warning
          team: platform-integrations
        annotations:
          summary: "Excessive Webhook Retry Volume Detected"
          description: "Retry attempts currently represent {{ $value | mul 100 | printf \"%.2f\" }}% of all webhook traffic."
8. Architectural Strategies to Improve FASR
+-----------------------------------------------------------------------+
|                 RECOMMENDED CONSUMER ARCHITECTURE                     |
|                                                                       |
|  [ Ingress Gateway ] ──> [ Lightweight Receiver ]                     |
|                                |                                      |
|                                v  (Acknowledge HTTP 202 in < 20ms)     |
|                      [ Internal Queue (Redis/Kafka) ]                 |
|                                |                                      |
|                                v                                      |
|                      [ Async Worker Pool ] ──> [ Database ]           |
+-----------------------------------------------------------------------+
Strategy 1: Async Queue Ingestion
The most common cause of low FASR is synchronous processing on the consumer side. Receivers should verify the signature, write the payload to an internal queue (Redis Stream, RabbitMQ, SQS), and immediately respond with HTTP 202 Accepted. Heavy database writes happen asynchronously downstream. This is the exact pattern Stripe's own integration guidance and third-party guides converge on: return 2xx before doing anything that could take more than a couple of seconds, and treat "receipt" and "processing" as two separate steps.
Strategy 2: Idempotent Processing (don't skip this)
Because virtually every provider guarantees at-least-once delivery (never exactly-once), duplicate deliveries are expected, normal behavior — not a bug in the provider or your pipeline. Stripe, for instance, explicitly documents that manually resending an event doesn't cancel its own automatic retries, so the same event can legitimately arrive more than once. Build your handlers to be idempotent: persist the provider's event ID, check it before applying side effects, and treat a repeat delivery of an already-processed event ID as a no-op success. Skipping this step is one of the most common causes of double-charged customers or duplicated records in webhook-driven systems.
Strategy 3: Dynamic Rate-Limiting with Backpressure Negotiation
Producers should respect 429/503 responses and the Retry-After header, and dynamically throttle outbound workers for specific subscriber endpoints rather than hammering a struggling receiver on a fixed schedule.
Strategy 4: Circuit Breaking
When a destination fails 100% of its first attempts over a short window (e.g., during a subscriber outage), a circuit breaker trips the endpoint to a PAUSED state, preventing wasted retry traffic from flooding the pipeline. The circuit breaker pattern itself was popularized in distributed systems largely through Netflix's open-source Hystrix library — but it's worth knowing that Hystrix has been in official maintenance mode since 2018 per Netflix's own repository notice, with no new feature development. For new projects, Resilience4j (Java) or your platform's equivalent (many API gateways and service meshes implement circuit breaking natively) are the actively maintained choices; Spring Cloud's own circuit-breaker starter now points to Resilience4j rather than Hystrix.
9. Conclusion & Webhook Health Checklist
Relying on Eventual Success Rate alone creates a false sense of pipeline reliability. First-Attempt Success Rate is a useful early indicator of downstream strain, worker bottlenecks, and hidden infrastructure cost — and while it's not a formally standardized metric name, the concept is already load-bearing in the monitoring dashboards of real webhook infrastructure providers.
By exporting per-attempt telemetry into tools like Datadog and Prometheus, teams can get real operational visibility into webhook performance, alert on queue pressure before it becomes an outage, and know which downstream relationships are actually degrading.
Webhook Observability Checklist
- Track FASR as an operational metric, alongside ESR — not instead of it.
- Separate first-attempt and retry logs so aggregators can distinguish initial transmissions from retries.
- Break down failures by HTTP status code (429, 500, 502, 503, 504) to locate the actual bottleneck.
- Alert on queue pressure (retry-to-ingress ratio) before queues start backing up, not just on the success-rate threshold alone.
- Know your specific provider's contract. Check whether it auto-retries at all (some, like GitHub, don't), how long its timeout window is, and how long its retry period lasts, instead of assuming a generic "webhook" behavior.
- Build idempotent handlers. At-least-once delivery means duplicates are a certainty, not an edge case.
Sources & Further Reading
- Stripe — Receive Stripe events in your webhook endpoint (retry window, timeout, best practices)
- GitHub Docs — About webhook delivery failures and Redelivering webhooks
- Svix Docs — Retry Schedule and Webhook timeout best practices
- Recurly Docs — Automatic retries
- Hookdeck Docs — Metrics and Building a Reliable Service for Sending Webhooks
- AWS Docs — Application Load Balancers: idle timeout attribute (default 60s)
- Wikipedia — Little's Law (queueing utilization factor ρ = λ/μ)
- Netflix — Hystrix GitHub repository notice on maintenance mode; Resilience4j project docs
- Datadog — datadogpy client library and DogStatsD documentation
- InstaWebhook — instawebhook.com (product feature descriptions)
Note: a few of the numeric targets in this article (e.g., >98% FASR, specific failure-code proportions) are presented as illustrative engineering benchmarks rather than figures published by any single authority — no such universal SLA exists publicly for first-attempt webhook success. Calibrate them against your own traffic before using them as alert thresholds.