eBPF-Based Webhook Observability: Catching Dropped Packets Before the Application Layer
Learn how to use eBPF and XDP to trace silent TCP drops, monitor socket backlog overflows, and protect webhook worker pods before latency spikes hit.
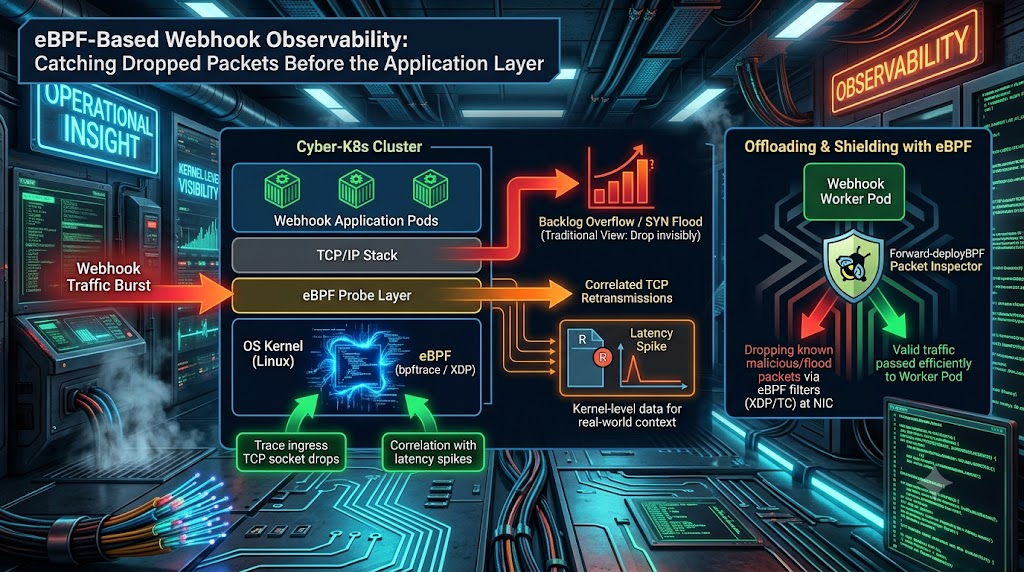
eBPF-Based Webhook Observability: Catching Dropped Packets Before the Application Layer
Executive Summary: The Invisible Webhook Drop Problem
Webhooks are the connective tissue of event-driven systems. Payment processors, code hosts and commerce platforms push state changes to subscriber backends over plain HTTP POST requests. Each provider has its own delivery rules, and those rules decide what a lost connection costs you:
| Provider | Delivery behavior (per provider docs) |
|---|---|
| Stripe | In live mode, retries for up to three days with exponential backoff. In a sandbox, retries three times over a few hours. |
| Shopify | Requires a 2xx response within five seconds. Retries failed deliveries up to eight times over about four hours, then removes the subscription if failures persist. |
| GitHub | Records a failure if your server is down or takes longer than 10 seconds to respond. It does not automatically redeliver failed deliveries. |
Retries can mask a kernel-level drop, but they also add delay and duplicate deliveries. With a sender that never retries, the event is simply lost.
Application Performance Monitoring (APM) is the usual way to watch webhook endpoints, and it has a structural blind spot. SDK-based agents (Datadog, New Relic, OpenTelemetry SDKs) run inside your process. Even the newer eBPF-based auto-instrumentation, such as OpenTelemetry eBPF Instrumentation (OBI, donated by Grafana Labs as Beyla in 2025), observes requests that have already reached a process. A connection the kernel never hands to your application produces no span, no log line and no status code.
[ Incoming Webhook Burst ]
           │
           ▼
┌───────────────────────────────────────────┐
│          Linux Kernel Network Stack       │
│ ┌───────────────────────────────────────┐ │
│ │ NIC Rx ring → (XDP) → sk_buff alloc   │ │
│ └──────────────────┬────────────────────┘ │
│ ┌──────────────────▼────────────────────┐ │
│ │ TCP: SYN queue → Accept queue         │ │ ──► [ DROPPED HERE ]
│ └──────────────────┬────────────────────┘ │     (APM never sees it)
└────────────────────┼──────────────────────┘
                     │ accept()
                     ▼
┌───────────────────────────────────────────┐
│       User-Space Application Runtime      │
│ ┌───────────────────────────────────────┐ │
│ │ Webhook worker / HTTP framework       │ │ ──► Seen by APM (HTTP 2xx/5xx)
│ └───────────────────────────────────────┘ │
└───────────────────────────────────────────┘
When the kernel discards a SYN or the final ACK of the handshake because a listening socket’s queues are full, the sender sees a connect timeout, a stalled request, or a reset. Your APM dashboard shows nothing unusual.
This article shows how to find those drops with eBPF, how to measure the latency they hide, and where XDP does and does not help. It also covers the kernel and application tuning that prevents most of them.
1. Anatomy of a Kernel-Level Webhook Drop
1.1 The ingress path
- NIC and DMA. Packets land in a receive ring buffer on the network interface card (NIC).
- XDP (optional). If an XDP program is attached in native mode, it runs in the driver’s receive path, before the kernel allocates an
sk_buff. - NAPI and SoftIRQ. The driver polls the ring and the kernel builds a
struct sk_bufffor each packet. - IP and TCP processing. The stack validates the packet and looks up the listening socket.
- Listener queues. New connections pass through the SYN queue and then the accept queue.
accept(). Only now does your application see the connection, whether it is a Node.js event loop, a Go server or a Python worker.
1.2 The two queues where webhooks die
As Cloudflare describes in SYN packet handling in the wild, every listening TCP socket has two queues:
- The SYN queue holds half-open connections (state
SYN_RECV) that have been sent a SYN+ACK and are waiting for the client’s final ACK. - The accept queue holds fully established connections waiting for the application to call
accept().
The maximum length of both queues derives from the backlog argument the application passes to listen(2). The kernel silently caps that value at net.core.somaxconn. The default for somaxconn was 128 before Linux 5.4 and has been 4096 since 5.4. The default for tcp_max_syn_backlog scales with machine memory, and the 5.4 kernel raised its maximum default from 2048 to 4096.
Accept queue overflow is the common webhook killer. If your runtime is busy, whether from a blocked event loop, an exhausted worker pool or a GC pause, it calls accept() late and the accept queue fills. Per Cloudflare’s analysis, once the accept queue is full, the kernel drops both inbound SYN packets and inbound final-handshake ACK packets. The counters that move are TcpExtListenOverflows and TcpExtListenDrops.
What the sender experiences depends on net.ipv4.tcp_abort_on_overflow:
0(default). The kernel silently drops the final ACK. From the client’s side the handshake looks complete. Its request data goes unacknowledged until the server’s SYN+ACK retransmission timer and the client’s own retransmissions eventually line up with free space in the queue, or the connection times out. Dropped SYNs appear to the client as connect timeouts that are retried with exponential backoff.1. The kernel sends a RST after the final ACK, and the sender sees a connection reset. Cloudflare’s advice is that it is better to leave this setting alone, because resets make overload worse for clients that would otherwise retry.
SYN queue overflow is rarer than it used to be. Linux enables SYN cookies by default (net.ipv4.tcp_syncookies=1). When a listener’s SYN queue is full, the kernel answers with a stateless SYN cookie instead of storing the request, so legitimate connections generally survive a SYN flood. Plain SYN queue drops still show up in TCPReqQFullDrop-style counters when cookies are disabled or unavailable.
Either way, the application receives zero bytes for the affected connection, so an APM agent has nothing to record.
2. Tracing Ingress Drops with eBPF
Counters like nstat -az TcpExtListenOverflows TcpExtListenDrops tell you that drops happened, but not which source, port or connection was hit. For a quick check on a live host, ss -ltn is the fastest tool. For listening sockets, Recv-Q is the current accept queue depth and Send-Q is its configured maximum. A Recv-Q pinned at Send-Q means the application is not accepting fast enough.
eBPF adds per-event context without recompiling the kernel or attaching intrusive debuggers.
2.1 The skb:kfree_skb tracepoint and drop reasons
Since Linux 5.17, kfree_skb carries a drop reason that explains why a socket buffer was discarded. These reasons are available in RHEL 8.8 and 9.2 and later, and the tracepoint is the main interface for reading them. Coverage has grown over time but is not complete. Kernel patches in 2022 added reasons for accept queue overflow and request queue full, originally named LISTENOVERFLOWS and TCP_REQQFULLDROP. Enum names have been reorganized in later releases, so check the symbols your kernel actually exposes in /sys/kernel/tracing/events/skb/kfree_skb/format.
On older kernels, some listen-queue drops are not reported through kfree_skb at all, because the packet is freed as if it had been consumed normally. If a trace shows nothing while ListenDrops keeps climbing, this is the likely reason. Rely on the counters, and use the kprobe approach in Script 2.
A note on the snippets below. They are illustrative sketches. They assume a kernel with BTF (
CONFIG_DEBUG_INFO_BTF), bpftrace 0.21 or later (older releases useargs->fieldinstead ofargs.field), and IPv4 traffic. Kprobe targets are not a stable ABI, so confirm the function names exist on your kernel (bpftrace -l 'kprobe:tcp_v4_*') and test in staging before running them in production.
Script 1: Who is being dropped, and why
This script counts dropped inbound TCP packets for webhook ports, by source address and drop reason.
#!/usr/bin/env bpftrace

tracepoint:skb:kfree_skb
/args.protocol == 0x0800/
{
    $skb = (struct sk_buff *)args.skbaddr;
    $iph = (struct iphdr *)($skb->head + $skb->network_header);

    if ($iph->protocol == 6) {                      // TCP
        $tcp   = (struct tcphdr *)($skb->head + $skb->transport_header);
        $dport = bswap($tcp->dest);

        if ($dport == 8080 || $dport == 443) {
            @drops[ntop($iph->saddr), $dport, args.reason] = count();
        }
    }
}

interval:s:10
{
    time("%H:%M:%S  drops by (source, dport, reason):\n");
    print(@drops);
    clear(@drops);
}
The reason field prints as a number. Map it to a name using the format file mentioned above. Packets freed before the TCP header is parsed may carry an unset transport_header, so treat results as indicative rather than exhaustive.
Script 2: Accept queue pressure per listening port
The kernel considers the accept queue full when sk_ack_backlog exceeds sk_max_ack_backlog. The check runs on the listener socket in both tcp_v4_conn_request (incoming SYN) and tcp_v4_syn_recv_sock (final ACK). Both functions receive the listener as their first argument, so one probe covers both paths.
#!/usr/bin/env bpftrace

kprobe:tcp_v4_conn_request,
kprobe:tcp_v4_syn_recv_sock
{
    $sk = (struct sock *)arg0;

    @max_depth[$sk->sk_num] = max($sk->sk_ack_backlog);

    if ($sk->sk_ack_backlog > $sk->sk_max_ack_backlog) {
        @queue_full[probe, $sk->sk_num] = count();
    }
}

interval:s:10
{
    time("%H:%M:%S\n");
    print(@max_depth);
    print(@queue_full);
    clear(@max_depth);
    clear(@queue_full);
}
If you would rather not maintain probes, BCC and libbpf-tools ship maintained utilities for this area. tcpdrop, tcpretrans and tcpsynbl cover drops, retransmissions and SYN backlog depth.
3. Correlating Kernel Waits with Latency Spikes
When the kernel drops a SYN, the sender waits for its retransmission timer. Per RFC 6298, the initial retransmission timeout is 1 second, and each failed attempt doubles it:
RTO_n = RTO_0 × 2^n (RTO_0 = 1 s for the initial SYN)
So a client’s SYN retries leave at roughly 1 s, 3 s, 7 s, 15 s and so on after the first attempt. Linux’s tcp_syn_retries setting caps how many times a client tries before giving up. Once a connection has RTT measurements, the minimum RTO in Linux is 200 ms, so established connections recover faster than new ones. A first-SYN drop is therefore especially expensive.
A webhook whose first SYN is dropped and whose retry succeeds arrives about a second late, even though your handler runs in milliseconds:
 Sender (Webhook Provider)                      Receiver (Your Pod)
───────────┬───────────                        ───────────────┬───────────────
           │ 1. SYN                                           │
           │─────────────────────────────────────────────────►│ ──► Dropped (accept queue full)
           │                                                  │
           │ [ sender waits: initial RTO ≈ 1 s ]              │
           │                                                  │
           │ 2. SYN (retransmission #1)                       │
           │─────────────────────────────────────────────────►│ ──► Accepted
           │ 3. SYN-ACK / 4. ACK                              │
           │◄────────────────────────────────────────────────►│
           │ 5. HTTP POST /webhook                            │
           │─────────────────────────────────────────────────►│ ──► Handled in ~15 ms
           ▼                                                  ▼
   [ Sender-side latency ≈ 1,015 ms ]               [ APM duration ≈ 15 ms ]
This matters because the delay is short enough to hide inside a retry policy but long enough to cross a hard deadline. Shopify’s five-second response limit and GitHub’s ten-second limit are both reachable after two or three SYN retransmissions.
Measuring the hidden wait
You can measure this on the receiver. The idea is to remember when each client’s first SYN was dropped, then measure the gap when the same client port tries again. That gap is the retransmission wait your APM never sees.
#!/usr/bin/env bpftrace

tracepoint:skb:kfree_skb
/args.protocol == 0x0800/
{
    $skb = (struct sk_buff *)args.skbaddr;
    $iph = (struct iphdr *)($skb->head + $skb->network_header);
    if ($iph->protocol == 6) {
        $tcp = (struct tcphdr *)($skb->head + $skb->transport_header);
        if (bswap($tcp->dest) == 8080 && $tcp->syn == 1 && $tcp->ack == 0) {
            if (@first_drop[$iph->saddr, $tcp->source] == 0) {
                @first_drop[$iph->saddr, $tcp->source] = nsecs;
            }
            @syn_drops = count();
        }
    }
}

kprobe:tcp_v4_conn_request
{
    $skb = (struct sk_buff *)arg1;
    $iph = (struct iphdr *)($skb->head + $skb->network_header);
    $tcp = (struct tcphdr *)($skb->head + $skb->transport_header);
    if (bswap($tcp->dest) == 8080) {
        $t0 = @first_drop[$iph->saddr, $tcp->source];
        if ($t0 != 0) {
            @syn_retry_gap_ms = hist((nsecs - $t0) / 1000000);
            delete(@first_drop[$iph->saddr, $tcp->source]);
        }
    }
}
A histogram with clusters near 1,000 ms, 2,000 ms and 4,000 ms is the signature of SYN retransmission backoff. Bpftrace maps have a bounded size, so for long-running production use, port this logic to a libbpf program with an LRU hash map. Then export the histogram with a tool such as Cloudflare’s ebpf_exporter.
Metrics worth alerting on
You do not need a custom exporter to start. The Prometheus node_exporter netstat collector exposes the relevant kernel counters by default:
node_netstat_TcpExt_ListenOverflowsandnode_netstat_TcpExt_ListenDropstrack accept queue overflows and listener drops.node_netstat_TcpExt_TCPSynRetranstracks SYN retransmissions.node_netstat_TcpExt_SyncookiesSentshows when a SYN queue overflowed and cookies kicked in.
Alert on any sustained increase in ListenDrops. Compare the rate of change to your APM request rate, and a divergence tells you traffic is arriving that your application never sees.
4. Mitigation Patterns: Where eBPF/XDP Helps and Where It Doesn’t
Tracing finds the problem. Fixing it is mostly about how fast your application accepts connections, and secondarily about what the kernel does under load.
4.1 First, fix the queue
- Raise the effective backlog. The kernel uses the smaller of the application’s
backlogandnet.core.somaxconn, so raise both. Frameworks differ: Node.js’sserver.listen()defaults to a backlog of 511, and Go’s standard library derives its default fromsomaxconn. - Know the container caveat.
net.core.somaxconnis namespaced per container. In Kubernetes it is classed as an unsafe sysctl, so setting it from a pod’ssecurityContext.sysctlsrequires the kubelet to allow it with--allowed-unsafe-sysctls. - Accept fast, process later. Shopify’s own guidance is to delay processing until after you have sent a response. A small receiver that verifies the signature, enqueues the payload to a durable queue (Kafka, SQS) and returns 2xx keeps
accept()and response times short, even when downstream work is slow.
4.2 What XDP is good for
XDP is a driver-level eBPF hook. In native mode it runs before sk_buff allocation, so dropping a packet costs very little. In Cloudflare’s benchmark, XDP_DROP discarded roughly 10 million packets per second on a single core. Newer drivers and hardware report substantially higher figures. Dropping at the socket or in the application costs far more per packet, and that gap is why XDP is used for DDoS mitigation at Cloudflare and for L4 load balancing in Meta’s Katran.
That makes XDP a strong fit for removing traffic you never wanted before it can compete with real webhooks for CPU and queue slots. It is a poor fit for rate-limiting legitimate webhook senders.
Do not rate-limit webhook providers per source IP at the packet level. Providers send from a small set of addresses. Stripe, for example, publishes a list of about a dozen webhook IPs, and GitHub publishes hook ranges through its /meta API. A per-IP, per-packet limiter would throttle your most important traffic, including its retransmissions and the data packets of a single request.
A safer use is a blocklist, or the inverse, an allowlist. Drop traffic to your webhook port that does not come from provider-published ranges:
#include "vmlinux.h"
#include <bpf/bpf_helpers.h>
#include <bpf/bpf_endian.h>

#define ETH_P_IP 0x0800

struct {
    __uint(type, BPF_MAP_TYPE_HASH);
    __uint(max_entries, 65536);
    __type(key, __u32);      // IPv4 source address
    __type(value, __u8);
} blocklist SEC(".maps");

SEC("xdp")
int xdp_blocklist(struct xdp_md *ctx)
{
    void *data     = (void *)(long)ctx->data;
    void *data_end = (void *)(long)ctx->data_end;

    struct ethhdr *eth = data;
    if ((void *)(eth + 1) > data_end)
        return XDP_PASS;
    if (eth->h_proto != bpf_htons(ETH_P_IP))
        return XDP_PASS;

    struct iphdr *ip = (void *)(eth + 1);
    if ((void *)(ip + 1) > data_end)
        return XDP_PASS;
    if (ip->protocol != 6)           // TCP only
        return XDP_PASS;

    __u32 src = ip->saddr;
    if (bpf_map_lookup_elem(&blocklist, &src))
        return XDP_DROP;

    return XDP_PASS;
}

char LICENSE[] SEC("license") = "GPL";
For provider ranges (CIDR blocks rather than single addresses), use a BPF_MAP_TYPE_LPM_TRIE instead of a hash map. A user-space controller can refresh the map from the providers’ published lists.
Three limits to keep in mind:
- XDP cannot read TLS-protected HTTP. It sees packet headers, not webhook payloads, endpoints or signatures. Anything that needs the HTTP layer still belongs in your ingress or application.
- Native XDP needs driver support. Generic (SKB-mode) XDP works anywhere but runs after
sk_buffallocation, losing most of the performance advantage. XDP_REDIRECTdoes not forward to another node.BPF_MAP_TYPE_DEVMAPredirects to another network device on the same host, andBPF_MAP_TYPE_CPUMAPredirects to another CPU. Steering overflow traffic to a buffering tier on a different machine needs an encapsulating load balancer (Katran uses IPIP encapsulation) or a normal L4/L7 proxy in front of your workers. It is not something a stock XDP program does on its own.
5. Production Checklist for SREs
| Layer | Recommended action | Why it matters |
|---|---|---|
| Kernel tuning | Confirm net.core.somaxconn (4096 default on 5.4+, 128 before) and net.ipv4.tcp_max_syn_backlog. Keep tcp_syncookies=1 and leave tcp_abort_on_overflow=0 unless you have measured a reason to change it. | Prevents low queue limits on older kernels from dropping bursts. |
| Application | Set an explicit listen backlog, and return 2xx quickly. Move processing off the request path. | Keeps accept() fast; this is the only fix for the root cause of accept queue overflow. |
| Kubernetes | Allow and set net.core.somaxconn per pod where needed (unsafe sysctl). | The setting is per network namespace, so node-level tuning does not reach pods. |
| Counters | Alert on node_netstat_TcpExt_ListenDrops, ListenOverflows and TCPSynRetrans. | Cheapest possible signal that the kernel is dropping what the app never sees. |
| eBPF tracing | Use skb:kfree_skb (kernel 5.17+ for drop reasons) and listener-queue kprobes; try BCC/libbpf-tools tcpdrop, tcpretrans, tcpsynbl. | Adds source, port and reason context to the raw counters. |
| Edge filtering | Use XDP blocklists or provider-range allowlists for webhook ports; do not packet-rate-limit providers. | Removes unwanted traffic cheaply without harming real senders. |
| Resilience | Reconcile against provider APIs (GitHub’s delivery API, Stripe’s event list), and make handlers idempotent. | Covers deliveries lost without retry, and duplicates created by retry. |
Conclusion
Application-layer observability starts after accept(). The drops that matter most during a webhook burst happen before it, in listener queues the application cannot see. eBPF closes that gap: kernel counters tell you something is wrong, kfree_skb drop reasons and listener-queue probes tell you where and why, and a retransmission-gap histogram turns invisible kernel waits into a number you can alert on.
The fix usually lives in the application and its queue sizing, with XDP as an efficient front-line filter for traffic you do not want. Add idempotent handlers and provider-side reconciliation, because providers differ sharply in whether they retry at all.
Sources and Further Reading
- Cloudflare, SYN packet handling in the wild
- Cloudflare, How to drop 10 million packets per second
- Red Hat, How to retrieve packet drop reasons in the Linux kernel
- Linux man-pages,
listen(2) - IETF, RFC 6298: Computing TCP’s Retransmission Timer
- Stripe docs: webhooks and IP addresses
- GitHub docs, Handling failed webhook deliveries
- Shopify docs, Troubleshoot webhooks
- Grafana Labs, OpenTelemetry and Grafana Labs: what’s new in 2026