Distributed Observability: Tracing Webhooks with OpenTelemetry
Distributed Observability: Tracing Webhooks with OpenTelemetry In complex, cloud-native microservice architectures, engineers have largely moved away from plain-text logs toward...
Distributed Observability: Tracing Webhooks with OpenTelemetry
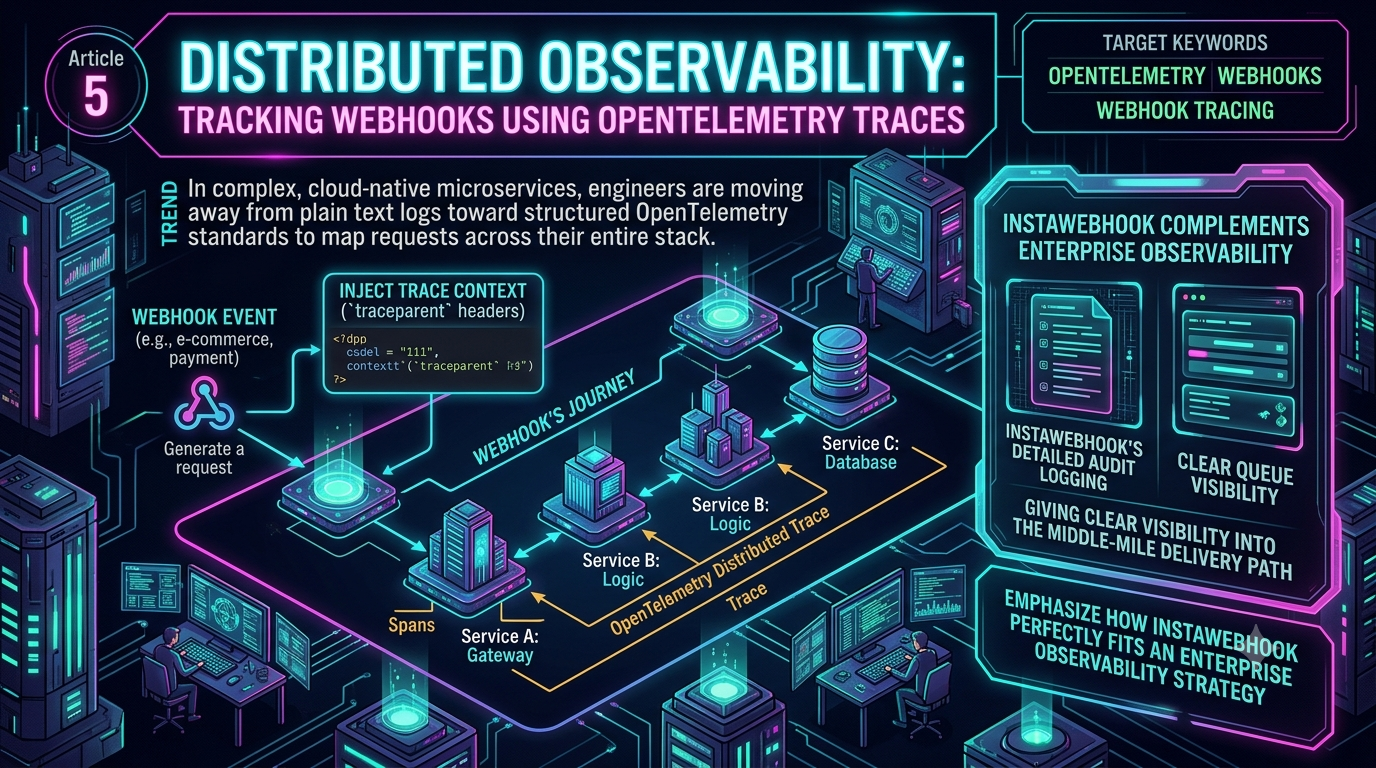
In complex, cloud-native microservice architectures, engineers have largely moved away from plain-text logs toward structured OpenTelemetry data to map requests across an entire stack. The days of grepping through millions of unstructured log lines to correlate a single event are effectively over — OpenTelemetry has become the default way modern teams collect traces, metrics, and logs.
As systems become more decoupled and event-driven, webhooks act as the connective tissue between microservices, third-party SaaS platforms, and internal systems. But webhooks introduce a blind spot: the moment an HTTP POST leaves one service to trigger an event in another, execution context is frequently dropped. The result is a fragmented trace, a broken customer journey, and hours spent piecing together what happened.
This guide covers how to inject W3C traceparent context into event-driven workflows so webhook calls stay part of a single distributed trace, what's changed in the underlying standards going into 2026, and how a delivery-tracking layer like InstaWebhook fills the gap OpenTelemetry can't cover on its own.
The 2026 Observability Landscape
OpenTelemetry's position in the ecosystem is no longer a matter of opinion — it's backed by numbers. In May 2026, the Cloud Native Computing Foundation moved OpenTelemetry to Graduated status, its highest maturity tier, alongside projects like Kubernetes, Prometheus, and Envoy. At the time of graduation, the project counted more than 12,000 contributors from over 2,800 companies, and in the trailing twelve months the OpenTelemetry JavaScript API package had been downloaded over 1.36 billion times, with the Python API package passing 1.3 billion downloads.
The project has also kept expanding beyond its original three signals (traces, metrics, logs). Continuous profiling reached public alpha in 2026, and there's growing interest in eBPF-based auto-instrumentation as a way to lower the barrier to adopting distributed tracing without touching application code.
None of that changes the core problem, though: OpenTelemetry's automatic instrumentation handles synchronous, in-process microservice communication (gRPC, HTTP interceptors) well. Asynchronous, event-driven webhook calls are a different story — and that's where deliberate webhook tracing becomes necessary.
Why Webhooks Break Distributed Traces
Distributed tracing works by visualizing a request as a unified "trace," made up of individual "spans." For a trace to stay unified, every participating service has to agree on how to identify it.
When a webhook fires, it often crosses network boundaries, proxies, API gateways, and the public internet. If trace context isn't explicitly carried along, the receiving service treats the incoming webhook as a brand-new, isolated request. The disconnect typically plays out like this:
- Service A (sender) starts a trace, does its work, and fires a webhook to Service B.
- A network boundary, proxy, or legacy queueing layer forwards the payload but strips custom headers.
- Service B (receiver) gets the payload with no trace context attached, so its OpenTelemetry SDK generates a brand-new trace ID.
- The causal link is gone. If processing fails in Service B, the observability backend shows Service A completing successfully and Service B failing for no apparent reason.
The fix is to rely on the W3C Trace Context specification — the standard OpenTelemetry uses by default for propagation.
The W3C Trace Context Standard
W3C Trace Context defines two HTTP headers for exchanging propagation data: traceparent and tracestate. traceparent reached full W3C Recommendation status, and it's the header that carries trace identity across service boundaries.
The traceparent header
traceparent: 00-4bf92f3577b34da6a3ce929d0e0e4736-00f067aa0ba902b7-01
Four hyphen-delimited fields:
- Version (
00) — an 8-bit value indicating the trace-context format version. - Trace ID (
4bf92f3577b34da6a3ce929d0e0e4736) — a 16-byte (32 hex character) identifier for the whole distributed trace. It must stay constant across the entire request journey. - Parent/Span ID (
00f067aa0ba902b7) — an 8-byte (16 hex character) identifier for the span that originated the webhook. - Trace flags (
01) — an 8-bit field indicating settings like sampling;01means the trace is sampled and should be recorded,00means it can be dropped.
The tracestate header
While traceparent carries the critical routing information, tracestate lets individual vendors append their own data — routing hints, internal platform metrics, custom sampling rules — without breaking the open standard.
What's changing: Trace Context Level 2
A second version of the spec, Trace Context Level 2, has been advancing through the W3C process as a Candidate Recommendation. It doesn't change the header format or break backward compatibility — a Level 2 traceparent still has the same four fields. What it adds is a new random-trace-id flag. When set, it signals that at least the right-most 56 bits (7 bytes) of the trace ID were generated with sufficient randomness, which lets samplers and sharding logic make stronger statistical guarantees about trace IDs they didn't generate themselves.
OpenTelemetry has picked this draft up as the foundation for its consistent (probability-based) sampling work: SDKs are moving toward setting the random flag by default and recording sampling decisions as a tracestate entry under the ot key. If you're building sampling logic on top of webhook traces, it's worth tracking this rollout — it directly affects how trustworthy your trace ID randomness assumptions are.
Implementing Webhook Tracing with OpenTelemetry
To get full distributed observability, you need to inject trace context into the outgoing webhook on the sender side, and extract it on the receiver side.
Step 1: The sender injects context
When your application prepares to fire a webhook, it's operating inside an active span. Extract that context and format it as W3C headers before sending the request.
import requests
from opentelemetry import trace
from opentelemetry.propagate import inject

tracer = trace.get_tracer(__name__)

def dispatch_webhook(payload, webhook_url):
    # Start a new span representing the webhook dispatch
    with tracer.start_as_current_span("dispatch_webhook_event") as span:
        headers = {
            "Content-Type": "application/json",
            "Authorization": "Bearer <token>",
        }

        # INJECT: pulls the active trace ID and span ID and populates
        # `headers` with 'traceparent' (and 'tracestate' if present)
        inject(headers)

        span.set_attribute("webhook.traceparent", headers.get("traceparent"))

        response = requests.post(webhook_url, json=payload, headers=headers)
        span.set_attribute("http.status_code", response.status_code)
        return response
Step 2: The receiver extracts context
The destination service intercepts the request, looks for the traceparent header, and tells OpenTelemetry to attach execution to the parent trace instead of starting a new one.
const express = require('express');
const { trace, context, propagation } = require('@opentelemetry/api');

const app = express();
app.use(express.json());

const tracer = trace.getTracer('webhook-receiver-service');

app.post('/webhook-endpoint', (req, res) => {
    // EXTRACT: parse the incoming headers for W3C trace context
    const activeContext = propagation.extract(context.active(), req.headers);

    // Start a new span, passing the extracted context as the parent
    tracer.startActiveSpan('process_incoming_webhook', {}, activeContext, (span) => {
        try {
            const payload = req.body;
            console.log('Processing webhook for trace:', span.spanContext().traceId);

            span.setAttribute('webhook.event_type', payload.event);
            res.status(200).send('Webhook processed successfully');
        } catch (error) {
            span.recordException(error);
            span.setStatus({ code: trace.SpanStatusCode.ERROR, message: error.message });
            res.status(500).send('Internal error');
        } finally {
            span.end();
        }
    });
});
With sender and receiver connected this way, your observability backend renders a single, continuous waterfall showing the actual latency between the webhook firing and the destination service finishing its processing.
Standardizing the Payload, Not Just the Headers
Trace context solves who this request belongs to. It doesn't solve what shape the event itself is in, and that gap has produced its own standardization effort worth pairing with your tracing work.
CloudEvents, a CNCF specification, defines a common envelope for event data — fields like specversion, type, source, id, and time — so consumers get a predictable structure regardless of which system produced the event. It's become widely used enough to be considered a common format for event payloads across providers, and it interoperates with platforms like Knative and Azure Event Grid. CloudEvents also has a formal webhook sub-specification covering delivery semantics and registration handshakes for HTTP-based webhooks.
Separately, the Standard Webhooks specification — an open, community-driven set of conventions — targets the producer/consumer relationship itself: consistent HMAC-based signature verification, retry expectations, and endpoint management, with reference signature-verification libraries published for Python, JavaScript/TypeScript, and other languages. It's designed to layer on top of existing webhook implementations without breaking them.
Neither of these replaces W3C Trace Context — they solve a different problem. But an event that follows CloudEvents' envelope format, is signed per Standard Webhooks, and carries a traceparent header gives you a payload that's simultaneously interoperable, verifiable, and traceable.
The "Middle-Mile" Problem
Webhook tracing solves endpoint-to-endpoint visibility, assuming the webhook actually arrives. But what happens if the network drops the request, or the receiver returns a 503 and the delivery needs to be retried later?
OpenTelemetry relies on spans being actively generated and exported. If a webhook is dropped by an intermediary, or fails to deliver because of a DNS or connection issue, the receiver never executes — so no receiver span is ever created. In your tracing backend, the trace simply ends at the sender. You're left with a cliffhanger and no way to tell, from the trace alone, whether the request is still queued for retry, was rejected, or vanished entirely.
Bridging the Delivery Gap
Closing that gap requires pairing application-layer tracing with an infrastructure layer that tracks delivery itself, independent of whether a span was ever generated. This is the role a dedicated webhook-delivery tool like InstaWebhook plays alongside OpenTelemetry.
Rather than routing a webhook directly at a receiving service, InstaWebhook ingests it at a durable endpoint and moves delivery work outside the request path. Each event carries a visible lifecycle — received, queued, attempted, retried, delivered, or dead-lettered — with timestamps for every state change, so when a receiver times out mid-deploy or a worker restarts during a billing event, you can see exactly where the delivery stalled instead of guessing from an abruptly-ending trace. Failed deliveries can be replayed with their original idempotency context intact once the downstream system recovers, and sensitive payloads can be routed through a "bring your own database" mode that keeps storage under the customer's own infrastructure rather than a third party's.
The division of labor is straightforward: OpenTelemetry and W3C Trace Context tell you what happened inside your services and how the pieces connect logically. A delivery-tracking layer tells you what happened in transit — whether the request left, whether it arrived, and what's still queued — even when no application code ever ran to generate a span.
Advanced Practices for Production Webhook Tracing
1. Payload injection for legacy systems
Some third-party vendors or rigid API gateways strip unrecognized HTTP headers, destroying traceparent data in transit. When you can't guarantee headers survive, fall back to payload injection: include a _metadata or trace_context object in the JSON body itself, and have the receiver parse the W3C string out of the body to manually construct the OpenTelemetry context.
2. Use baggage carefully
Alongside traceparent, OpenTelemetry supports a baggage header for passing arbitrary key-value pairs — tenant_id, plan_type, user_segment — across service boundaries so downstream spans, metrics, and logs can all be filtered by the same identifiers. The catch: baggage travels in plain-text HTTP headers and is included in most outgoing requests by automatic instrumentation, including calls to third-party services. OpenTelemetry's own documentation is explicit that baggage should never carry credentials, tokens, or PII, and that services should validate baggage received from untrusted sources rather than trusting it implicitly.
3. Span links instead of child spans for async work
Not every webhook should be modeled as a direct parent-child span relationship. If a webhook kicks off a background batch job that might run for hours, or that processes many webhooks together, a direct child span will skew your latency metrics badly. OpenTelemetry's messaging semantic conventions recommend span links for this case: the receiver starts a new root trace for the batch job, but links it back to the triggering webhook's span. This tells your backend "this job was triggered by that request, but runs as a separate, asynchronous execution" rather than forcing an artificial parent-child timing relationship.
4. Treat externally-sourced trace context as untrusted
If you expose a public webhook receiver, don't blindly trust incoming traceparent headers from external senders. OpenTelemetry's own guidance on context propagation warns that malicious actors can forge trace headers to manipulate tracing data or exploit context-parsing bugs, and recommends sanitizing incoming context — or deliberately starting a new root trace that links to the external trace ID — whenever a request crosses a public trust boundary.
Conclusion
The shift toward distributed, event-driven microservices requires a corresponding shift in how teams track requests in motion. Standardizing on webhook tracing with OpenTelemetry and W3C Trace Context — including the tighter randomness guarantees coming in Trace Context Level 2 — closes most of the blind spots inherent to async architectures. Pairing that with payload standards like CloudEvents and Standard Webhooks, and a delivery-tracking layer for the cases where no span is ever generated at all, gets you close to full visibility into an event's entire lifecycle: what happened logically inside your services, and what happened physically in transit between them.